The measure of gross domestic product, commonly referred to as GDP, has become the vital statistic by which economists and politicians gauge the health of the nation, the economic equivalent of checking a patient’s temperature, pulse rate and blood pressure all in one go. The following quote from the US Bureau of Economic Analysis gives an idea of the importance of GDP figures:
“GDP is one of the most comprehensive and closely watched economic statistics: It is used by the White House and Congress to prepare the Federal budget, by the Federal Reserve to formulate monetary policy, by Wall Street as an indicator of economic activity, and by the business community to prepare forecasts of economic performance that provide the basis for production, investment, and employment planning.”
A similar situation applies throughout the world, and because GDP figures are supposed to conform to an international standard, they give the best available data for comparing the relative strengths of national economies.
So, given that world economic policy is guided by these statistics, it would be rather unhelpful if they gave a misleading picture.
But such is the case: GDP, which in theory is a measure of economic output, or production, is actually a measure of economic activity, as recorded in terms of market prices. This mistaken assumption that the two things are effectively the same – I will show that they are not – means that all those policymakers around the world who base their decisions on these figures are likely to make incorrect assumptions that, in some cases, could have serious implications.
For example, government spending is likely to be based on over-optimistic forecasts of wealth creation; real earnings, and therefore tax revenues, will fall short of expectations; debt repayments will be relatively greater than planned for; welfare and pension provisions will be underfunded; businesses will make bad decisions regarding investment, and so on. These things happen all the time, and part of the reason is the widespread failure to understand one of the most basic economic indicators.
So what is GDP, really?
Gross domestic product is arrived at by combining the final market values of all economic activity, in terms of sales of goods and services. It can also be determined by adding up the net incomes and profits of all workers and businesses, or by calculating total spending in the economy. All three methods should in theory give the same result, though in practice they will never quite match because all such calculations are inevitably approximations, and will therefore include some margin of error. But that isn’t the problem.
The problem is that GDP, whichever way it is calculated, is treated as a measure of productive output, and therefore as an indicator of wealth creation and wellbeing, when in fact these days, in the modern developed economy, it is boosted by all kinds of unproductive and even harmful activities.
Because of this, GDP has become a poor indicator of an economy’s underlying strength, in terms of both genuine wealth creation and the wellbeing of the people, and I think this is one reason for the failure in recent decades to appreciate what is really going wrong in most modern economies.
For example, the ‘output’ in GDP terms of the typical advanced economy of today – Britain and the US in particular, but also most of Europe and other developed nations – consists mostly of unproductive service-sector activity. How does spending on healthcare equate to production? Or spending on security forces?
These are essential services, but to lump them together with the productive output of real industry, as if they were creators of wealth rather than consumers of wealth, must surely lead to confusion at best, and probably much worse in terms of muddled policies.
Britain’s Office for National Statistics (or ONS), provider of official data to the government, actually states that: “The production approach to GDP … is the sum of all production activity within an economy.” It then explains that productive activity equates precisely to the “output of all goods and services produced”.
But what do services produce?
The service sector, which constitutes four-fifths of Britain’s economy in terms of GDP, is by definition unproductive: that is the whole point of naming it such. What does a servant produce? What does a nurse produce? Or a police officer?
We can all agree that a teacher, for example, provides a vital service that undoubtedly adds value to a nation’s productive ability, but in terms of production this value is already measured as increased industrial output.
The retail sector helps industry to sell its goods, again providing a useful service, but production of the goods has already taken place in the manufacturing sector, obviously.
So services don’t produce, though they can add value to productive industry. But not all services add as much value as education or even retail. The value added by healthcare, in strictly economic terms, is minimal at best. There might well be value in getting a sick labourer back into the workforce as quickly as possible, but how much economic value can there be in spending huge sums on those who are no longer productive?
Healthcare is clearly a drain on resources, and becoming more so as the population ages. There is a moral and social need for such spending in a civilized society, as the recent coronavirus pandemic reminded us, but to count this spending as productive output is misleading, especially when such misunderstanding affects senior policymakers.
To give a recent example, the ONS reported that UK GDP grew by 0.5% in May, 2022, following two months in which it had declined.
“This growth was driven by human health activities … mainly driven by a large rise (15%) in GP appointments in England.”*
The fact that more people needed to see a doctor gave a boost to the Chancellor of the Exchequer, who said it was “great to see the economy growing again”.
[NOTE: *ONS statistical bulletin, 13 July 2022: GDP monthly estimate for May 2022 ]
The production of debt
The biggest distortion of GDP figures, however, comes by way of the financial sector, which in Britain accounts for around ten percent of the economy directly, and 34% if associated businesses are included (finance being closely linked with insurance, accountancy, real estate and legal services: see chart).
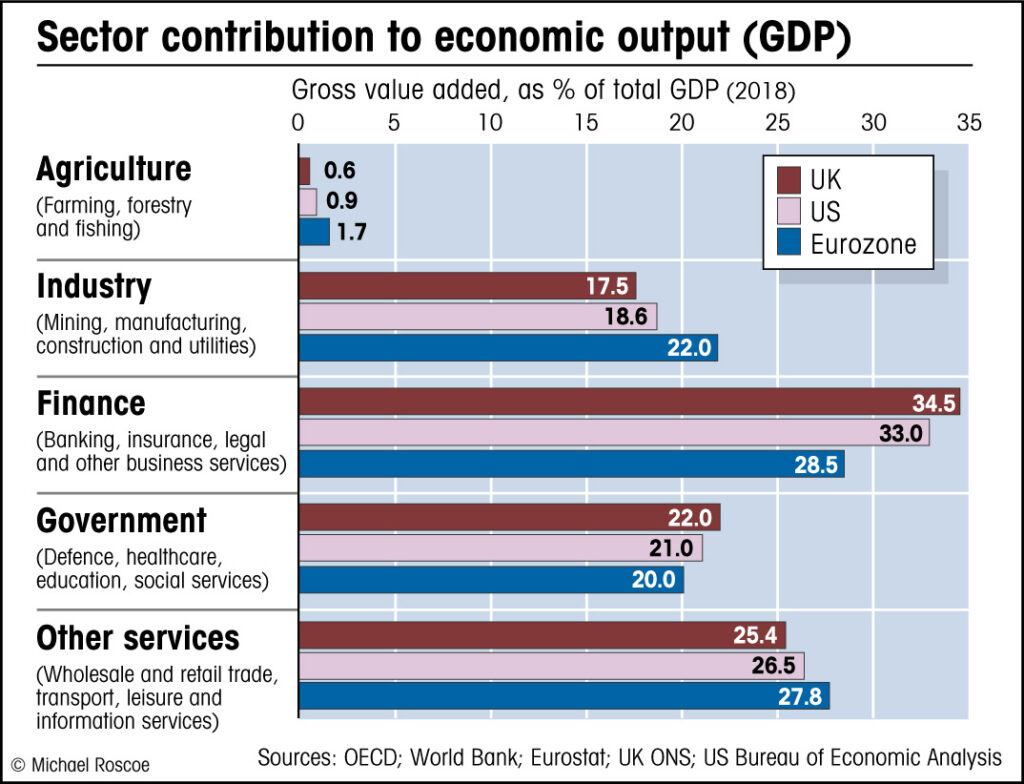
But this share of GDP, which implies that finance has become more important to the British economy than manufacturing, is seriously misleading. What do banks actually produce? The correct answer, I suggest, would be nothing: their job is to manage payments and allocate funding (ie, to lend newly-created money) to wherever it is needed for investment in future industry, general business loans, mortgages and so on, thus providing a useful service to society. Actual production is done by the borrowers, not the lenders.
But let’s be fair and acknowledge that banks do create something: they create credit, which might also be called debt. And sure enough, according to the internationally recognized system of accounting used in such calculations (known as Financial Intermediation Services Indirectly Measured (FISIM), under the United Nations System of National Accounts), the creation of debt by private banks adds directly to GDP, whereby the loans count as the economic ‘output’ of the banks. So the more they lend, the greater their output.
In addition to this, if banks increase lending to home-buyers and property developers, as they have done in recent decades, the subsequent boom in real-estate prices and rents will raise GDP further, because the ‘output’ of estate agents, landlords and solicitors (plus ‘imputed’ housing rents and so on, as explained below) will rise, as will retail spending generally, due to the rise in consumer credit.
So even if all this extra spending is based on debt and increased rents, and must therefore be paid for out of future earnings, thus reducing the long-term disposable incomes of consumers, we shouldn’t worry too much because the all-important GDP figures will get a boost and everyone will assume that the economy is humming along nicely. All of this explains why GDP rose so much in the build-up to the financial crash of 2008, as shown in my next chart.
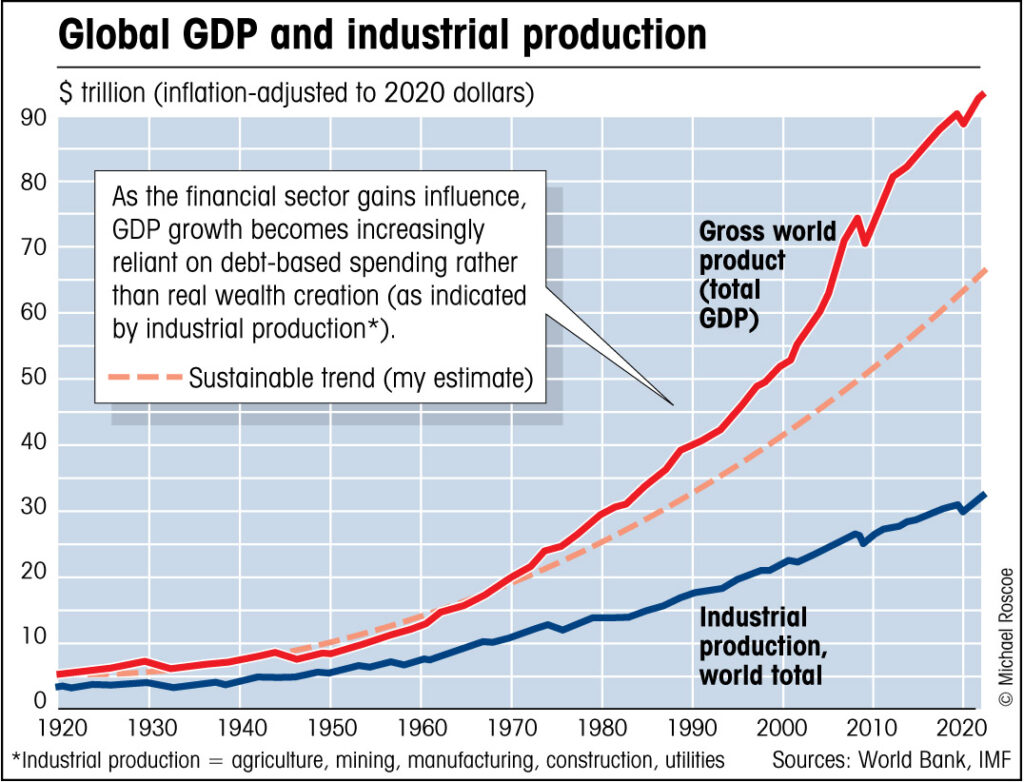
The chart shows how the long-term trend of global GDP growth corresponds to underlying industrial production, until the boom in credit that follows the deregulation and subsequent rise of the financial sector from the 1980s onwards, after which point GDP soars upwards of its own accord, apparently freed from the constraints of real production, magically creating wealth out of nothing, until the bubble bursts and reality intrudes for a while, before the whole charade begins all over again.
This might also explain why the post-crash recovery was so weak, despite all that newly-printed money being pumped into the financial sector, via the process known as quantitative easing, or QE.
Governments, or central banks, were hoping to boost GDP, along with prices, without considering the true economic implications of raising debt still further. They were hoping that entrepreneurs would borrow more money to expand businesses, even though the economic climate, with disposable incomes falling for many, was not conducive to business expansion.
They were also hoping that people would borrow more money, often by remortgaging their homes, to buy more stuff generally. This will add to GDP, which looks good on paper, but it also adds to the debt burden for little real gain, while repayments eat into future earnings.
Borrowing to buy a home is usually worthwhile, assuming the repayments are affordable: everyone needs a home. But borrowing to make improvements, or to buy a new car, etc, becomes less worthwhile as the real need for such things decreases, because going further into debt reduces disposable incomes without adding much value.
So GDP is boosted by debt, even if that debt is bad for the long-term prosperity of the nation.
The output of nothing
We see then that all spending, whether by individuals, businesses or government, adds to GDP, however unproductive it might be. This includes things like insurance premiums, medical care (whether public or private) and ‘imputed’ housing rental, which is the cost you would incur if you were renting your own home (or the ‘productive output’ of your home, when viewed as a service). This imputed housing rental, which is ‘output’ that doesn’t actually exist, constitutes around 10% of UK GDP (compared to 8% in the US and France, for example, where finance is less dominant).
Returning to my earlier point, it is also worth noting that GDP increases when a person is employed to do a job that they previously did without pay, such as household work, or growing food in a kitchen garden. If a woman who’d been a stay-at-home mother decided to work as a child-minder, say, she would enter the market economy and boost GDP, even though she might only be doing the same amount of work as she did before. She will be better off financially, of course, but her payment must come from her employer’s earnings, so unless that employer is able to produce more wealth because of the time gained by employing a child-minder (which is unlikely, unless that person works in productive industry), then the gain to GDP does not represent an overall gain to society, merely a redistribution of earnings from one household to another.
In the same way, gardeners who produce food for their own families or neighbours are not adding to GDP, whereas they would be if they did the same work for pay, or sold their produce at the local market.
For reasons such as these, the higher GDP figures of ‘developed’ economies do not necessarily signify greater underlying production, or useful work, than the lower figures of less-developed economies, which have a higher percentage of genuine economic activity going unrecorded, and a lower percentage of wasteful or fictitious GDP (such as imputed housing rents).
This is not to suggest that poorer nations are better off than we think they are (though many probably are, in some ways), merely that GDP figures tend to exaggerate the difference between the wealthiest and the less-developed economies. In other words, wealthier nations are not necessarily as rich as the debt-inflated GDP figures imply (ie, we Brits are not really ten times better off, on average, than people in Indonesia, for example, as implied by nominal GDP per capita).
Another related factor is that, once the genuine needs of society are satisfied, excess production becomes less valuable, because value is always a function of need. So extravagance and waste will add to GDP, even as it harms the environment; looking good on paper while the damage goes unrecorded.
We can see now that GDP is not really a measure of production, or even of output; it is primarily a measure of spending, including wasteful spending and spending based on credit, or debt, along with those ‘imputed’ rents, which represent spending that doesn’t actually take place. This explains why GDP can grow more quickly than both industrial production and the earnings of the majority of the population, as shown in my next chart, which compares different measures of earnings for the US (where the best long-term data is available, though the trend would be similar for the UK and most other countries).
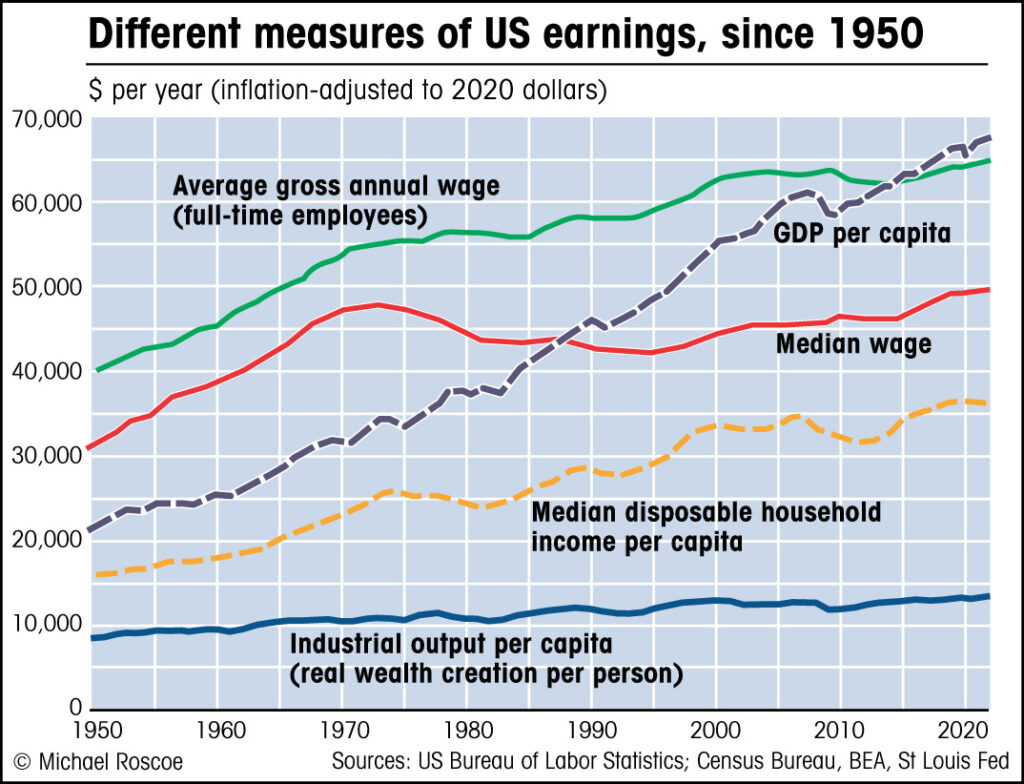
What does it mean when GDP is rising much more quickly than both industrial output and median incomes? There are several interconnected reasons for this divergence.
The first point is that economic activity, as measured by GDP, has been inflated by the excessive creation of debt relative to the creation of real wealth, and this is boosting spending without raising productivity or workers’ wages.
Such a process adds to GDP by increasing service-sector activity, because consumers spend on credit, while debt boosts asset prices that in turn raise incomes related to finance and real estate.
A second point is the related rise in inequality, following the process of financialization that began in the 1970s. Those at the top end of the income distribution – the financiers and corporate elite – profit from rising rents, asset prices and debt-related transfers from poor to rich, but those profits must come at the expense of the majority, whose disposable incomes therefore fall, so that demand then falls off and real industrial output declines further relative to GDP.
In other words, the whole process is an attempt at boosting growth by borrowing from future earnings: an unsustainable debt-fuelled binge that, as well as inflating bubbles that must eventually burst, also increases inequality, as seen in the difference between the average wage, which is boosted by high incomes at the top, and the median wage, which is more representative of the typical worker.
But the ruling elite don’t seem to understand what’s going on, for if they did they surely wouldn’t try to fix a debt problem by encouraging banks to create more debt. It might help if they had better data to work from, as well as more control over credit and money creation.
In my book, ‘From Brexit to Fixit: Why Britain is Getting Poorer and What We Should Do About It’, (from which this article is taken) I explain how we could improve our understanding of the genuinely productive forces that are essential to the economy, and how the UK government could reform our monetary system to enable greater investment in the industries that really matter for the wellbeing of the nation.